Pillar 2: Metrics - Know Your System's Vital Signs
Prometheus tracks performance trends and enables threshold-based alerting.
What is Prometheus?
Prometheus is an open-source monitoring and alerting toolkit designed for reliability and scalability. It's the de facto standard for metrics in cloud-native environments.
- Time-Series Database: Stores metrics with timestamps
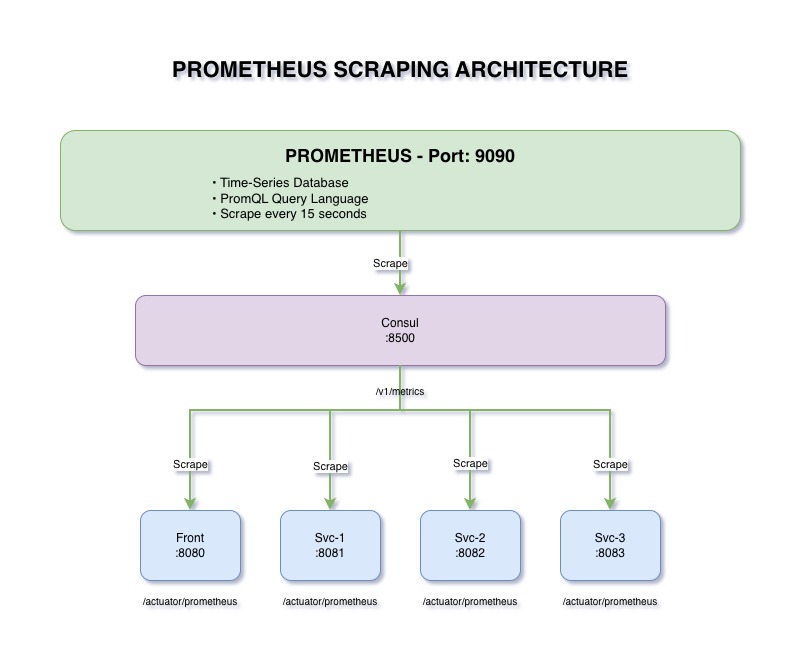
- Pull-Based Model: Scrapes metrics from services
- Powerful Query Language: PromQL for analysis
- Alerting: Threshold-based alerts
- Services expose
/actuator/prometheusendpoint - Prometheus scrapes this endpoint every 15 seconds
- Metrics stored in time-series database
- Query via PromQL for analysis
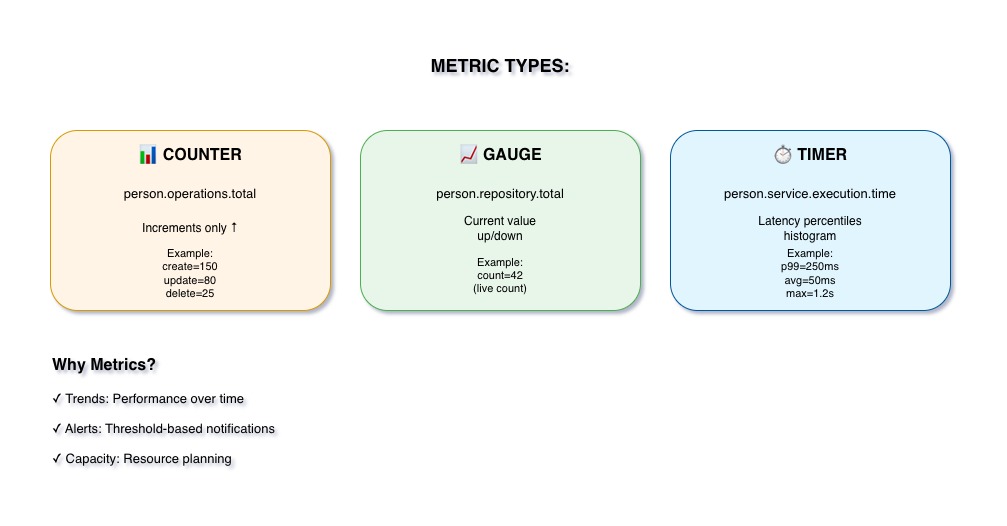
The Three Metric Types
Always Goes Up
Cumulative value that only increases (or resets to zero).
- Total requests
- Total errors
- Total operations
Example: person_operations_total{operation="create"}
Goes Up and Down
Current value that can increase or decrease.
- Current memory usage
- Active connections
- Queue size
Example: person_repository_total
Measures Duration
Tracks duration and count of events.
- Response time
- Method execution time
- Database query time
Example: person_service_execution_time
Why Metrics Matter
Metrics show patterns over time. Is response time gradually increasing? Is error rate spiking on weekends? Metrics reveal trends that individual logs cannot.
Set thresholds: "Alert me if response time > 500ms for 5 minutes" or "Alert me if error rate > 5%". Proactive alerting prevents incidents.
Understand resource usage patterns. How much memory do we need during peak hours? When will we need to scale? Metrics inform infrastructure decisions.
Track business operations, not just infrastructure. How many orders per hour? What's the conversion rate? Metrics bridge tech and business.
Our Prometheus Configuration
- Scrape Interval: 15 seconds
- Targets:
- Frontend:
http://front:8080/actuator/prometheus - Backend 1:
http://service-1:8081/actuator/prometheus - Backend 2:
http://service-2:8082/actuator/prometheus - Backend 3:
http://service-3:8083/actuator/prometheus
- Frontend:
- Retention: 15 days (configurable)
- Port: 9090
Spring Boot Integration
Spring Boot uses Micrometer as an abstraction layer for metrics. Micrometer provides a vendor-neutral interface that works with Prometheus, Grafana, and others.
- Auto-Configuration: Spring Boot automatically exposes metrics
- Actuator Endpoint:
/actuator/prometheusendpoint created - Default Metrics: JVM, HTTP, database connections, etc.
- Custom Metrics: Easy to add via
MeterRegistry
PromQL Query Examples
person_operations_totalReturns total count of all operations
rate(person_operations_total[5m])Operations per second over last 5 minutes
person_operations_total{operation="create"}Only create operations
avg(person_service_execution_time_seconds)Average execution time across all services
Key Takeaways
- Prometheus scrapes metrics from all services via /actuator/prometheus
- Three metric types: Counters (total), Gauges (current), Timers (duration)
- Time-series data reveals trends and patterns
- Foundation for alerting and capacity planning
- Micrometer provides vendor-neutral abstraction in Spring Boot