Putting It All Together: Debugging in Action
Follow a real investigation: "Person creation is slow sometimes" - from problem to solution.
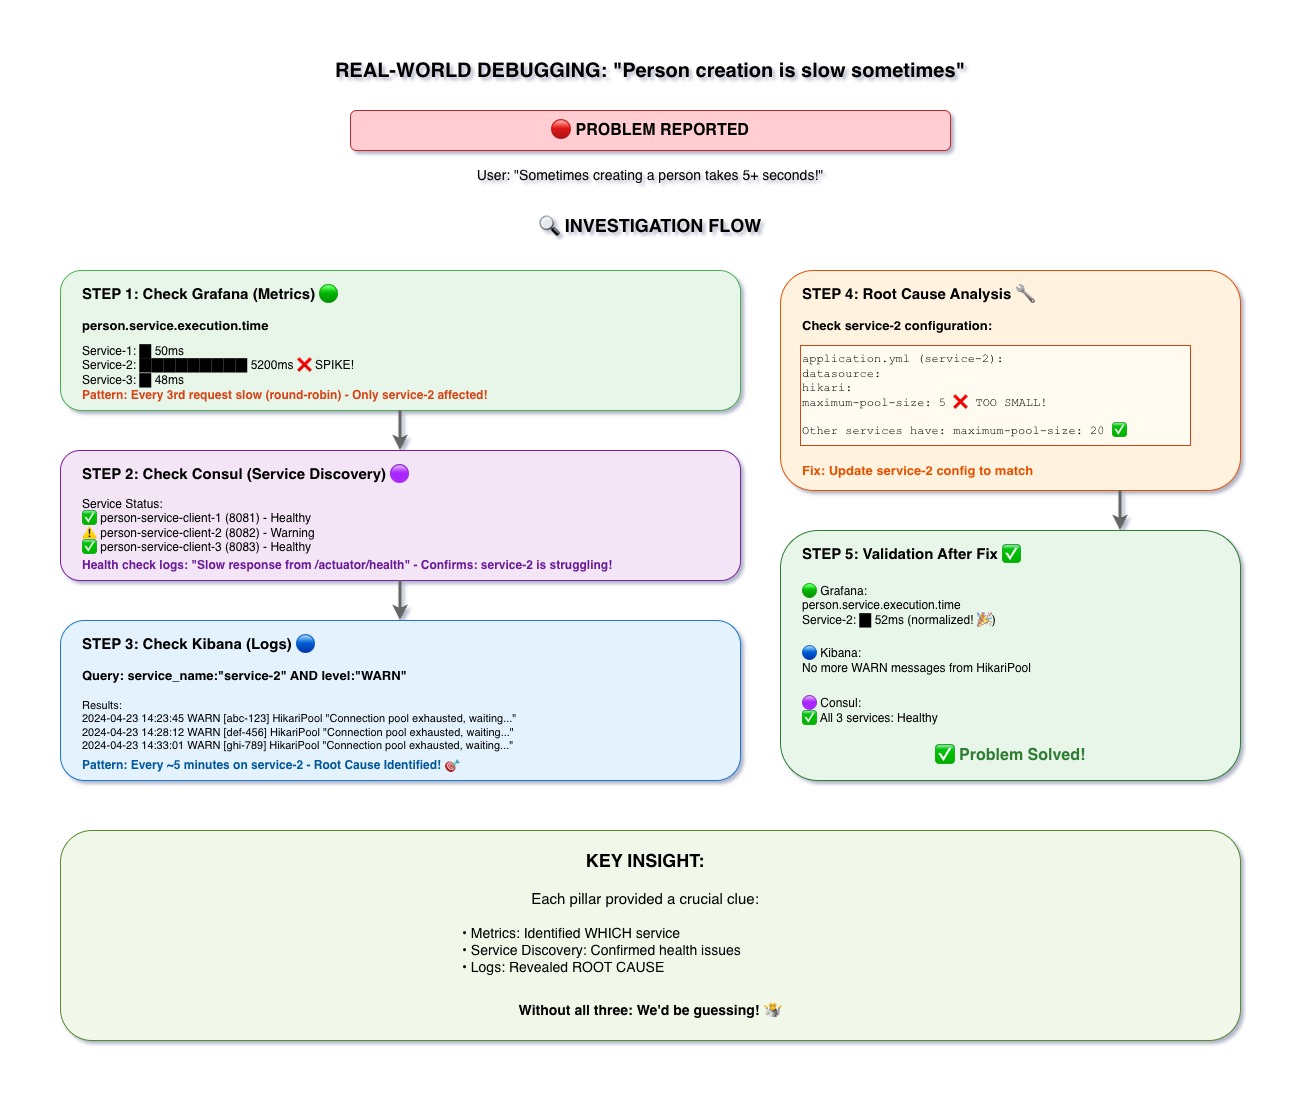
The Scenario
User Report: "Creating a person is slow sometimes - takes 5+ seconds!"
Without observability, this would be a nightmare to debug. Let's see how our tools help us solve it.
Step 1: Check Grafana (Metrics) 🟢
Action: Look at person.service.execution.time metrics
Discovery:
- Service-1: ~50ms (normal)
- Service-2: ~5200ms (spike!) ❌
- Service-3: ~48ms (normal)
Pattern: Every 3rd request is slow (round-robin load balancing)
Conclusion: Only service-2 is affected!
Step 2: Check Consul (Service Discovery) 🟣
Action: Check service health status
Discovery:
- person-service-client-1: ✅ Healthy
- person-service-client-2: ⚠️ Warning - Slow health check response
- person-service-client-3: ✅ Healthy
Conclusion: service-2 is struggling, confirmed by health checks
Step 3: Check Kibana (Logs) 🔵
Action: Search for warnings from service-2
Query: service_name:"service-2" AND level:"WARN"
Discovery: Multiple warnings about connection pool exhaustion:
2024-04-23 14:23:45 WARN [abc-123] HikariPool
"Connection pool exhausted, waiting..."Pattern: Happens every ~5 minutes on service-2
Conclusion: Root cause identified! 🎯
Step 4: Root Cause Analysis 🔧
Check configuration:
application.yml (service-2):
  datasource:
    hikari:
      maximum-pool-size: 5  ❌ TOO SMALL!

Other services have: maximum-pool-size: 20 ✅Fix: Update service-2 config to match (maximum-pool-size: 20)
Step 5: Validation After Fix ✅
- Grafana: person.service.execution.time normalized (~52ms for service-2)
- Kibana: No more WARN messages from HikariPool
- Consul: All 3 services showing Healthy ✅
Problem Solved! 🎉
Key Takeaways
- Real debugging requires all three pillars working together
- Metrics identified WHICH service was slow
- Service discovery confirmed health issues
- Logs revealed the ROOT CAUSE
- Without all three: guessing instead of knowing